Q1 2025 review: analyzing the impact of tariffs and geopolitical dynamics
If the first quarter of 2025 were a movie, it would probably be another installment of the Fast and Furious franchise. The unanswered questions surrounding potential tariffs on Canada, Mexico, China, and Europe have indeed come fast and furious, leading to much uncertainty and volatility in the markets.

As the locals tend to say about the weather in Scotland, with an air of bemused resignation, “If you don’t like the weather, wait five minutes.” It’s a sentiment that many investors can relate to in light of the current trading environment.
The heightened sensitivity to this geopolitical landscape is reflected in the recent spike in the Global Economic Policy Uncertainty Index (GEPU), which tracks the frequency of mentions of certain words and terms that are used to describe and explain economic policy. It’s perhaps no coincidence that the Cboe Volatility Index (VIX)―the market’s go-to index to gauge market volatility―is strongly correlated with the GEPU.
An increase in global economic uncertainty leads to market volatility
GEPU vs. VIX
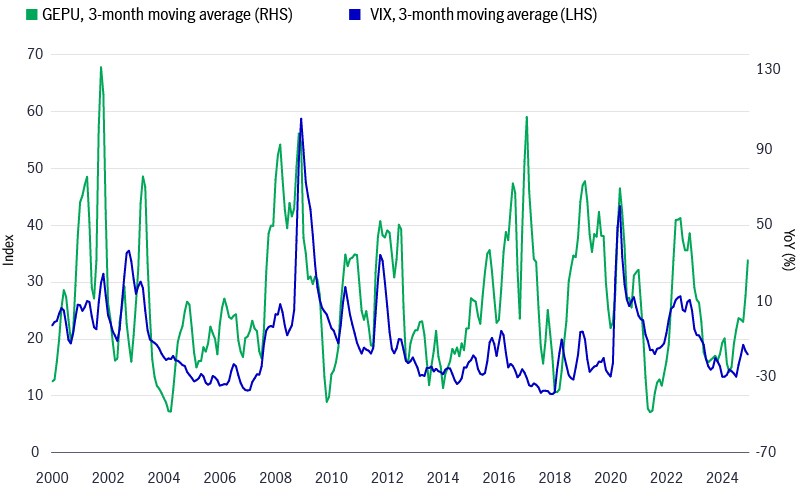
As a result, after two years of limited volatility—barring a brief spell last summer—investor appetite for risk assets has decreased. Equity markets in North America suffered during the first quarter: The S&P 500 Index, S&P/TSX Composite Index, Nasdaq Composite Index, and Russell 2000 Index were 4.6% $USD%, +0.8% $CAD, –8.3% $USD, and –9.8% $USD, respectively, during the quarter.1
There were some areas of positivity, however, as Europe and China fared much better, with the MSCI Europe Index and the MSCI Asia Pacific ex Japan Index respectively ending the quarter +5.3% $EUR and +1.4% $USD higher.1 It was as though investors took their proverbial ball out of North America and decided to play elsewhere.
European markets were supported by changing attitudes toward additional fiscal spending among policymakers, leading to improved growth expectations. News that Purchasing Managers’ Indexes in the eurozone region for both the manufacturing and services sectors have come off extreme lows also added to momentum. Chinese equities benefited from Beijing’s renewed focus on domestic growth.
On the fixed-income side, there are signs that the negative correlation between stocks and bonds may be strengthening. North American fixed income had a relatively positive quarter: Canadian and U.S. bonds measured by the FTSE Canada Universe Bond Index and the Bloomberg U.S. Aggregate Bond Index respectively gained +2.0% $CAD and +2.8% $USD in the first three months of 2025.1 In our view, this highlights the important role that bonds typically play in asset allocation decisions as a tool to mitigate volatility.
How we’re thinking about the markets
If it feels like we’re repeating ourselves, that’s because we are, but some messages are worth repeating. In periods of uncertainty, investors should ask themselves whether the situation is likely to be disruptive or destructive in nature. We believe the current backdrop is more likely to be disruptive, like the many other geopolitical developments that we’ve experienced in the past.
Policymakers may be planning to use tariffs as a tool in future trade negotiations. In our view, while it could be part of an effort to secure leverage in eventual trade talks with Canada, things may not be quite so straightforward. We highlight three critical areas that help support a strong argument in Canada’s favour.
1 The auto industry
- A car can cross the U.S.-Canada and/or the U.S.-Mexico border as often as eight times throughout the manufacturing process. According to reports, tariffs could cause car prices to increase by up to $12,000 for some models.2
- Canada exports roughly 1.5 million cars to the United States.3 Building car manufacturing capacity isn’t just a capital-intensive undertaking―it also takes time. The process is likely to take years and may well lead to disruptions in the interim.4
- A report suggests that if U.S. automakers were to move manufacturing activities back to the United States, it would likely lead to higher prices. In the longer term, labour costs could increase 10%, while light-vehicle sales may decline by the same percentage.4
2 Oil
- Many U.S. refineries are designed to process Canada’s heavy crude, Western Canadian Select (WCS). Of 130 U.S. refineries, 25 use Canada’s WCS (roughly 20%).5 If they went offline, it’s reasonable to assume that U.S. consumers would see a sharp increase in gasoline prices.
- Fifteen years ago, about 140,000 barrels of Canadian oil made their way to the United States daily. Today, the number is closer to 450,000 barrels because of improved pipeline infrastructure. Oil transportation is much less efficient for oil imported from outside North America.5
3 Potash
- Canada is the world’s biggest producer of potash, a key ingredient in fertilizers used in crop farming, followed by Russia, Belarus, and China.6 The United States, as it happens, imports some 85% of its potash from Canada.7
- Potash production in Russia and Belarus has fallen in the past few years due to geopolitical events,5 a development that may make it challenging for U.S. farmers to find alternative viable sources of potash in the short term, which could translate into higher prices for U.S. consumers.
We believe that the Trump administration judges its performance by the health of the U.S. economy and the stock market, and chances are that, at some point, the administration will seek to negotiate a solution with their counterparts. What that will take―a sustained pullback in the stock market, or even a bear market―is impossible to know. One thing that’s clear to us, however, is that as of the end of the quarter, we’re not near crisis levels yet.
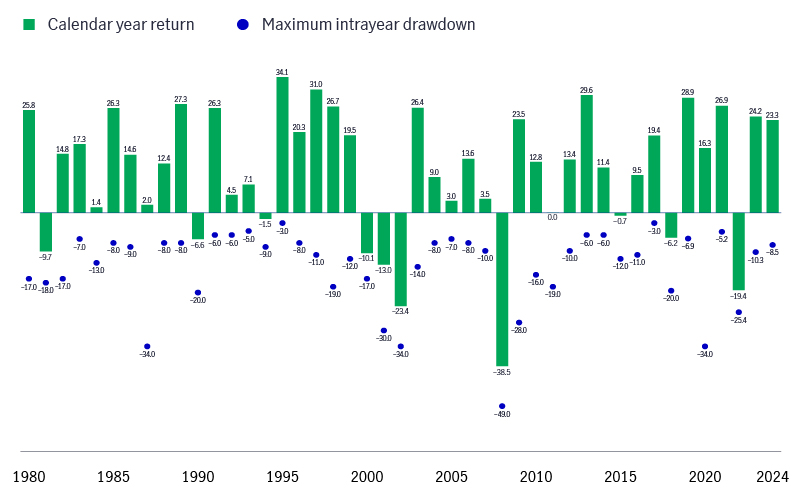
Stock market corrections are both very common and very difficult to predict. Since 1980, the likelihood of the S&P 500 Index slipping into correction territory (i.e., a drop of 10% or more) within a calendar year is higher than 50%, and the average market retracement amid a sell-off in any given calendar year is ~14%. The broader context against that eye-catching data is that the market has historically stayed in the positive column roughly 78% of the time for the calendar year, posting an average return of ~10%.
Corrections are normal
Stock market corrections are very common and very difficult to predict. Since 1980, the S&P 500 Index has fallen an average of ~14.0% in any given calendar year but has been positive 77.0% of the time, with an average return of ~10.0%
With policy uncertainty likely to remain heightened in the near term, outbursts of market volatility will likely continue. So what should investors do in times like these? Our response, once again, may sound familiar and, potentially, a little boring: In uncertain times, we believe that investors should focus on solutions that are more targeted to downside protection than trying to capture upside risk.
When you’re at the height of the storm, it can be difficult to remember that sunny days might be just around the corner. Storms, however, do end. What’s important is to remain calm until they do.
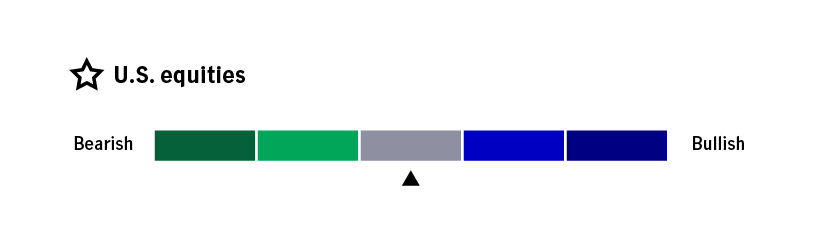
Our views on U.S. equities
- Material shift toward negative sentiment is likely overdone in the near term
- Valuation remains elevated but no longer stretched
- Market breadth has improved, supporting a more active investment approach, including mid-cap securities
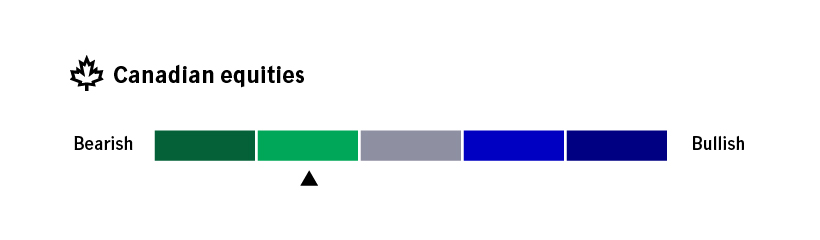
Our view on Canadian equities
- Weaker economic backdrop driven by the cautious consumer and tariff uncertainty could put pressure on earnings growth
- Index-level valuation is above the historical average on a trailing price/earnings basis
- Index depth and breadth remain an issue
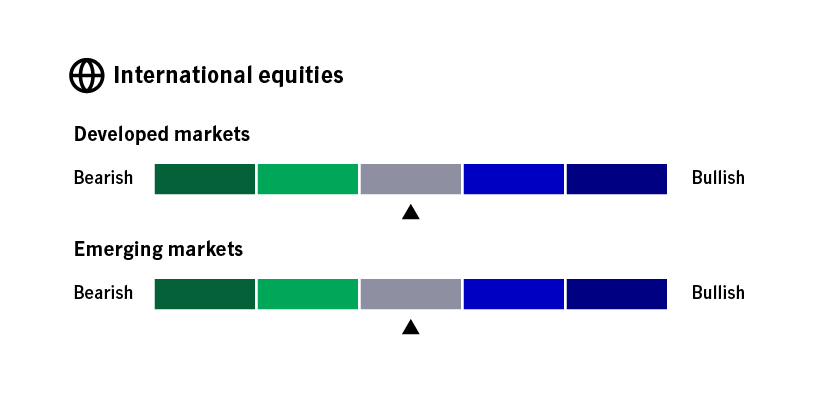
Our views on international equities
- U.S. Federal Reserve and Bank of Canada’s dovish stance support duration positioning in the 5–10 year area for sovereign debt
- Fundamentals for investment-grade credit remain solid; focus should be on security selection
- High-yield spreads remain historically tight; risk of additional spread widening could hurt lower-quality credit
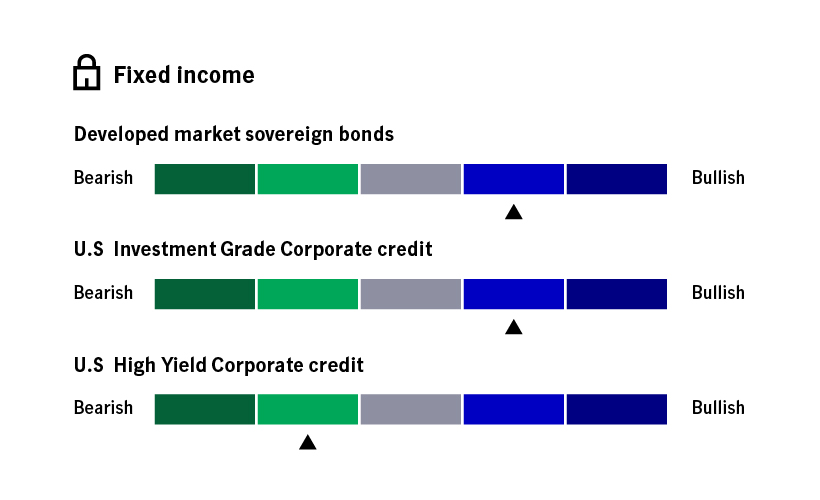
Our views on fixed income
- U.S. Federal Reserve and Bank of Canada’s dovish stance support duration positioning in the 5–10 year area for sovereign debt
- Fundamentals for investment-grade credit remain solid; focus should be on security selection
- High-yield spreads remain historically tight; risk of additional spread widening could hurt lower-quality credit
1 Bloomberg, as of March 31, 2025. Returns for the S&P 500 Index, Nasdaq Composite Index, Russell 2000 Index, MSCI All Country Asia ex Japan Index, and the Bloomberg U.S. Aggregate Bond Index are in U.S. dollars. Returns for the S&P/TSX Composite Index and the FTSE Canada Universe Bond Index are in Canadian dollars. Returns for the MSCI Europe Index is in the euro. 2 “Trump to impose 25% tariff on all imported vehichles and foreign-made auto parts,” NBC News, March 26, 2025. 3 “How do Trump’s tariffs affect Canadian business? We answer your questions,” www.theglobaland mail.com, March 21, 2025. 4 “S&P Global says auto industry has 1 week before massive production halt due to tariffs,” Detroit Free Press, March 13, 2025. 5 “Explainer: Why Canadian oil is so important to the United States,” Canadian Energy Centre, January 30, 2025. 6 Potash facts, Government of Canada, February 2, 2025. 7 “What is potash and why is the U.S. dependent on Canada for it,” National Post, March 9, 2025.
Important disclosures
The Global Economic Policy Uncertainty (GEPU) Index is measured based on purchasing power parity-adjusted GDP of 21 countries. The S&P 500 Index tracks the performance of 500 of the largest companies in the United States. The S&P/TSX Composite Index is the benchmark Canadian index that tracks the performance of companies listed on the Toronto Stock Exchange (TSX). The NASDAQ Composite Index is a market-value-weighted index that tracks the performance of all stocks listed on the NASDAQ Stock Market. The Russell 2000 Index tracks the performance of 2,000 small-cap companies in the United States. The MSCI Europe Index tracks the performance of large- and mid-cap stocks of developed-market companies in Europe. The MSCI Asia-Pacific ex Japan Index tracks the performance of large- and mid-cap stocks across developed-market countries in the Asia-Pacific, excluding Japan. The Bloomberg U.S. Aggregate Bond Index tracks the performance of U.S. investment-grade bonds in government, asset-backed, and corporate debt markets. The FTSE Canada Universe Bond Index tracks the performance of the Canadian dollar-denominated investment-grade fixed income market, covering Canadian government, quasi-government and corporate bonds.
Investing involves risks, including the potential loss of principal. Financial markets are volatile and can fluctuate significantly in response to company, industry, political, regulatory, market, or economic developments. The information provided does not take into account the suitability, investment objectives, financial situation, or particular needs of any specific person.
Views are those of the authors and are subject to change. No forecasts are guaranteed. This commentary is provided for informational purposes only and is not an endorsement of any security, mutual fund, sector, or index, and is not indicative of any John Hancock fund. Diversification does not guarantee a profit or eliminate the risk of a loss. Past performance does not guarantee future results.
All overviews and commentary are intended to be general in nature and for current interest. While helpful, these overviews are no substitute for professional tax, investment or legal advice. Clients and prospects should seek professional advice for their particular situation. Neither Manulife Investment Management, nor any of its affiliates or representatives (collectively “Manulife Investment Management”) is providing tax, investment or legal advice.
This material is intended for the exclusive use of recipients in jurisdictions who are allowed to receive the material under their applicable law. The opinions expressed are those of the author(s) and are subject to change without notice. Our investment teams may hold different views and make different investment decisions. These opinions may not necessarily reflect the views of Manulife Investment Management. The information and/or analysis contained in this material has been compiled or arrived at from sources believed to be reliable, but Manulife Investment Management does not make any representation as to their accuracy, correctness, usefulness, or completeness and does not accept liability for any loss arising from the use of the information and/or analysis contained. The information in this material may contain projections or other forward-looking statements regarding future events, targets, management discipline, or other expectations, and is only current as of the date indicated. The information in this document, including statements concerning financial market trends, are based on current market conditions, which will fluctuate and may be superseded by subsequent market events or for other reasons. Manulife Investment Management disclaims any responsibility to update such information.
Manulife Investment Management shall not assume any liability or responsibility for any direct or indirect loss or damage or any other consequence of any person acting or not acting in reliance on the information contained here. This material was prepared solely for informational purposes, does not constitute a recommendation, professional advice, an offer or an invitation by or on behalf of Manulife Investment Management to any person to buy or sell any security or adopt any investment approach, and is no indication of trading intent in any fund or account managed by Manulife Investment Management. No investment strategy or risk management technique can guarantee returns or eliminate risk in any market environment. Diversification or asset allocation doesn’t guarantee a profit or protect against the risk of loss in any market. Unless otherwise specified, all data is sourced from Manulife Investment Management. Past performance does not guarantee future results.
This material has not been reviewed by, and is not registered with, any securities or other regulatory authority, and may, where appropriate, be distributed by Manulife Investment Management and its subsidiaries and affiliates, which includes the John Hancock Investment Management brand.
© 2025 Manulife Investment Management. All right reserved. Manulife Wealth and/or Manulife Private Wealth are using with permission. The statements and opinions expressed in this article are those of the author. Manulife Wealth and/ or Manulife Private Wealth cannot guarantee the accuracy or completeness of any statements or data.
Manulife, Manulife Investment Management, Stylized M Design, Manulife Investment Management & Stylized M Design, Manulife Wealth & Stylized M Design and Manulife Private Wealth & Stylized M Design are trademarks of The Manufacturers Life Insurance Company and are used by it, and by its affiliates under license.
4357822

